1. Ocean Data Query
1.1. Coastal Ocean Observing Systems
Note
Now, more than ever, there is a need for regional to global observing systems that can provide accurate real-time data and forecasts on coastal ocean conditions.
The ocean plays a role in everyone’s life. It affects weather and climate patterns around the globe, hosts an abundance of wildlife that support fishing industries and provide food for the world, serves as a highway for vessels that deliver everyday materials, and supports economies as a tourism destination.
The coastal ocean is the part of the earth system where land, water, air, and people meet together. Populations, businesses, and infrastructure are increasing along coastlines, which are all susceptible to changing coastal ocean conditions.
Coastal ocean observing systems (COOS) are necessary for advancing our understanding on the state of the coastal ocean worldwide and its impact on matters of societal importance. These systems integrate a network of people, organisations, technologies, and data to share advances, improve research capabilities, and provide decision-makers with access to information and scientific interpretations.
1.1.1. Data acquisition
Important
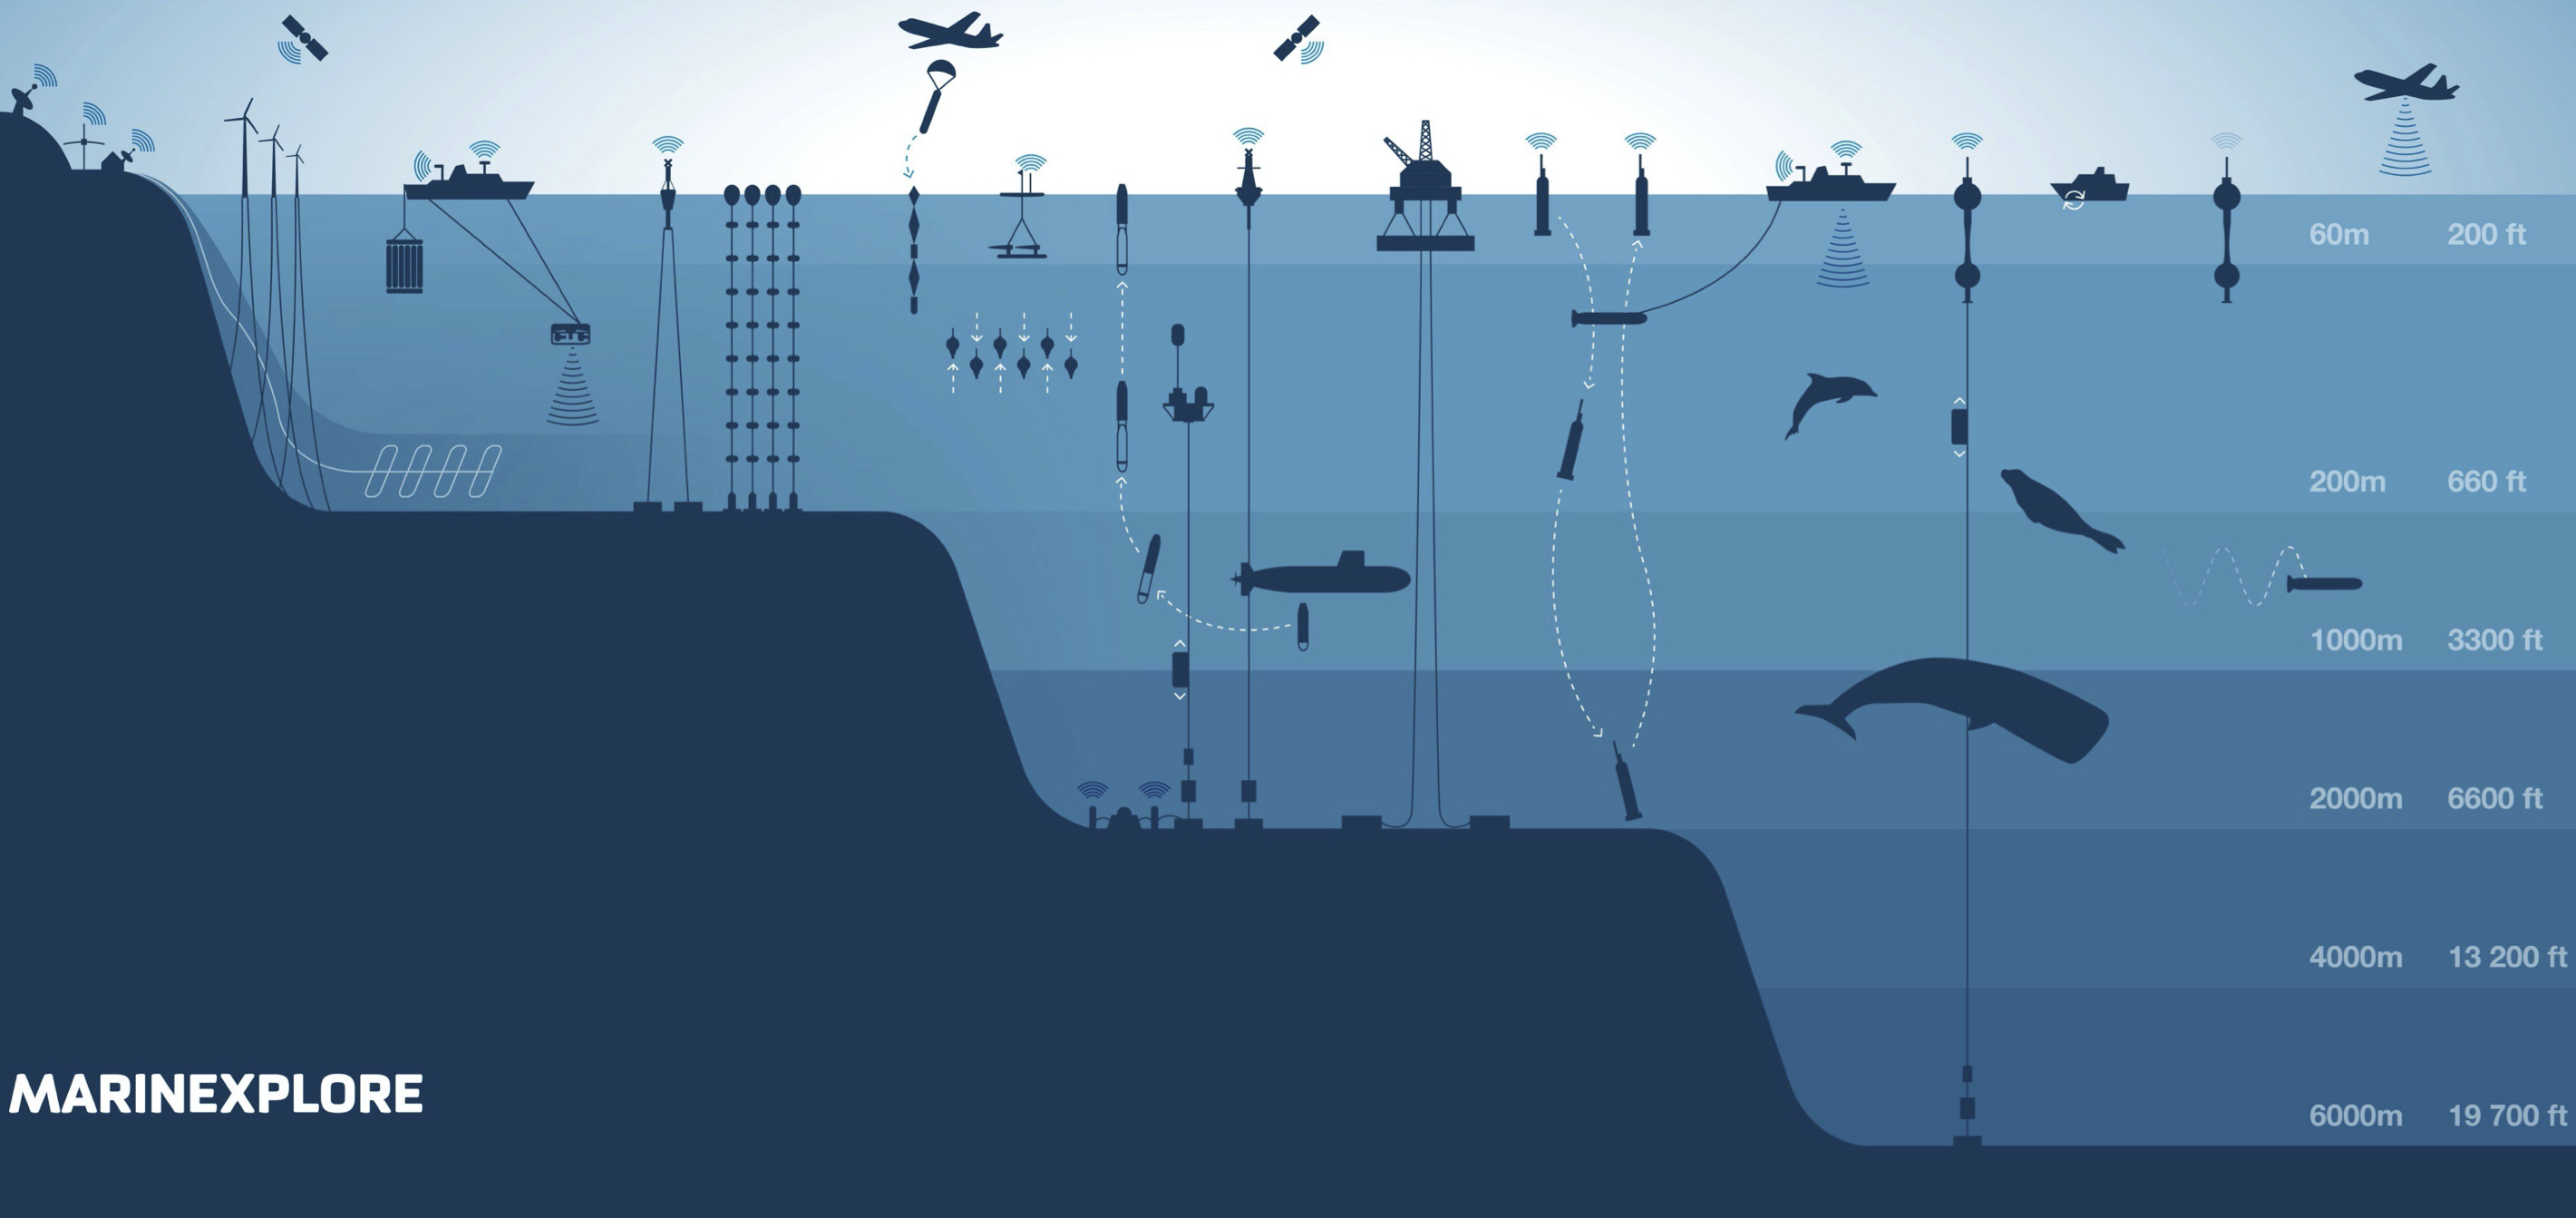
Data, observations, and models integrated into the COOS come from a variety of platforms, including, for example, moorings, high-frequency (HF) radars, underwater gliders and profilers, satellites, and ships. The resulting data are used to better understand, respond to, and prepare for short-term events such as oil spills, harmful algal blooms, and fish kills, longer term changes in our oceans resulting in acidification, hypoxia, and sea level rise, and in everyday decisions related to maritime operations, public health, and management of healthy ecosystems.
1.1.2. A bit of history
Matthew Fontaine Maury (1806/1873) was an American astronomer, Confederate Navy officer, historian, oceanographer, meteorologist, cartographer, author, geologist, and educator.
He was nicknamed Pathfinder of the Seas and Father of Modern Oceanography and Naval Meteorology and later, Scientist of the Seas for his extensive works in his books, especially The Physical Geography of the Sea (1855), the first such extensive and comprehensive book on oceanography to be published. Maury made many important new contributions to charting winds and ocean currents, including ocean lanes for passing ships at sea.
As a sailor, Maury noted that there were numerous lessons that had been learned by ship masters about the effects of adverse winds and drift currents on the path of a ship. The captains recorded the lessons faithfully in their logbooks, but they were then forgotten. At the US Naval Observatory, Maury uncovered an enormous collection of thousands of old ships’ logs and charts in storage in trunks dating back to the start of the US Navy. He pored over the documents to collect information on winds, calms, and currents for all seas in all seasons. His dream was to put that information in the hands of all captains.
Maury became convinced that adequate scientific knowledge of the sea could be obtained only by international cooperation. He proposed for the United States to invite the maritime nations of the world to a conference to establish a universal system of meteorology, and he was the leading spirit of a pioneer scientific conference when it met in Brussels in 1853.
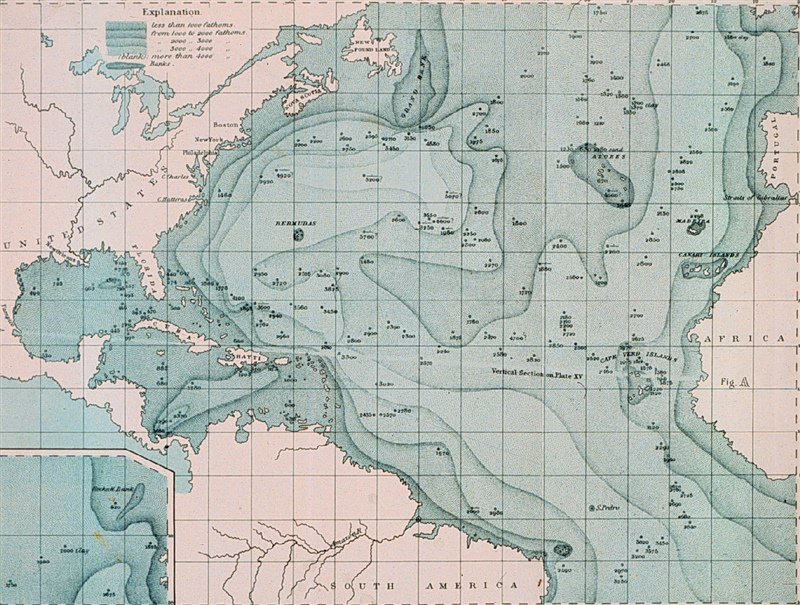
A second attempt at a bathymetric map by Matthew Fontaine Maury, published in The Physical Geography of the Sea with black and grey shading: source.
As a result of the Brussels Conference, a large number of nations, including many traditional enemies, agreed to cooperate in the sharing of land and sea weather data using uniform standards. It was soon after the Brussels conference that Prussia, Spain, Sardinia, the Free City of Hamburg, the Republic of Bremen, Chile, Austria, and Brazil, and others agreed to joined the enterprise.
Within a few years, nations owning three fourths of the shipping of the world were sending their oceanographic observations to Maury at the Naval Observatory, where the information was evaluated and the results given worldwide distribution.
Note
Maury’s idea set the scene for what is now a Global Ocean Observing Infrastructure! Over the 19th and early 20th century a lot of measurements were made by diverse communities for their own needs (scientists, fishermen, commercial navigators…). However as more and more data was collected by divers communities, data was shared only among small communities and was not properly archived and it wasn’t done in a organised way. In situ archeology is a hard job providing questionable databases!
1.2. Why do we need ocean observing tools?
Until recently, the ocean was viewed as being an unlimited resource to be exploited (source: US National Academies of Science report on Economic Benefits of Oceanographic Research, 1964). Subsequent science, including that from national and international observing efforts, has changed what we know about the ocean.
Nowadays, we recognise that the ocean is a finite and shared resource that needs to be manage regionally, nationally, and worldwide.
Societal threats and challenges
There are a number of significant societal threats and challenges facing humans due to the changing ocean:
The increased frequency and intensity of coastal storms and resulting storm surges will affect our coastal communities and disrupt commerce, nationwide.
Sea level changes are threatening critical infrastructure worldwide.
Harmful algal blooms and oxygen-deficient dead zones threaten water supplies, fisheries, and coastal recreation.
Ocean acidification is negatively impacting coral reefs and shellfish harvesting.
The increasing size and number of vessels calling on ports present challenges for our already inadequate maritime infrastructure, and pose potential environmental risks as well.
The world’s growing population will increasingly rely on the ocean for food, but fishing must be done sustainably.
To be able to understand and manage the ocean, we need meaningful measures of the ocean’s state.
1.3. National & Global Ocean Observing Infrastructure
Observing systems are expensive; Australia invests billions of dollars in civil Earth observations to ensure that the nation’s decision-makers and managers have the information they need about climate and weather, disaster events, land-use change, ecosystem health, natural resources, and many other characteristics of the planet.
The ocean is a harsh environment in which to operate an observing system, from corrosion due to salinity to bio-fouling. The costs of maintaining instrumentation in this environment, accessing remote locations, and establishing sufficient communications with deployed technologies are significant.
IMOS had as its prime focus improving scientific understanding of ocean conditions, but the information it generates is increasingly being used by government agencies and other users to inform decisions. The main activities of IMOS are based around:
Deploying, maintaining, and developing advanced observations technologies
Providing free and open access to data in support of a wide range of users
Advancing modeling
Focusing on education
In addition to providing observations and data to a large and growing number of research projects, student projects, and academic courses, IMOS is now recognised as an essential partner in large, multi-institutional research programs across multiple sectors. It has contributed to 180 postgraduate projects, over 400 journal publications, and 250 research projects.
1.3.1. Coastal ocean observing systems development
Most large-scale coastal ocean observing systems are funded through national governments for their own interests, often with different foci, but the world’s oceans are connected, therefore partnering is the key to success. As an example, the U.S. Integrated Ocean Observing System (IOOS), Australia’s Integrated Marine Observing System (IMOS), or European Ocean Observing System (EOOS) are progressing in their respective regions and are working together to observe and compile ocean information in a way that is easily accessible to scientists and managers.
IMOS advances have benefited from an evolving set of ocean observing efforts. The envisioned concept was a coordinated national and international network of observations, data management, and analyses that systematically acquired and disseminated data and information on past, present, and future states of the oceans. The coastal ocean observing efforts are implemented via regional programs distributed around coastal regions.
Each program is designed to assess and predict the effects of weather, climate, and human activities on the state of the coastal ocean, its ecosystems and living resources, and on the world’s economy.
Note
The Australian IMOS was formed in 2007, with equipment deployed from the next year onward. Scientific ’nodes’ were formed broadly around state boundaries with both nationally unified overarching science goals and local priorities. The NSW-IMOS is an example of a successfully implemented ocean observing system along the coast of southeastern Australia. The current observational array is designed around pertinent science questions, leveraged existing data streams, and opportunities for further oceanographic research.
IMOS currently has a portfolio of 13 Facilities that undertake systematic and sustained observing of Australia’s marine environment, across scales (from open ocean, onto the continental shelf, and into the coast), and across disciplines (physics, biogeochemistry, and biology and ecosystems).
1.3.2. Ocean observing technologies
It is a complex task to measure the ocean in ways that deliver useful products for people. For example, to deliver a five-day weather forecast for any local region, meteorologists must sample the whole planet. Satellites are key tools that provide multispectral images, atmospheric soundings, and sea surface characteristics needed for these forecasts. While satellites enable us to see through the atmosphere, they can only measure the surface of the ocean, and this does not provide the detail needed for accurate weather prediction. Therefore, we also need a complement of in situ measurements that extend our reach to the depths of the oceans at all relevant scales of phenomena. In situ refers to systems that measure on or under the surface of the ocean in continuous and event-driven modes, automatically and by humans.
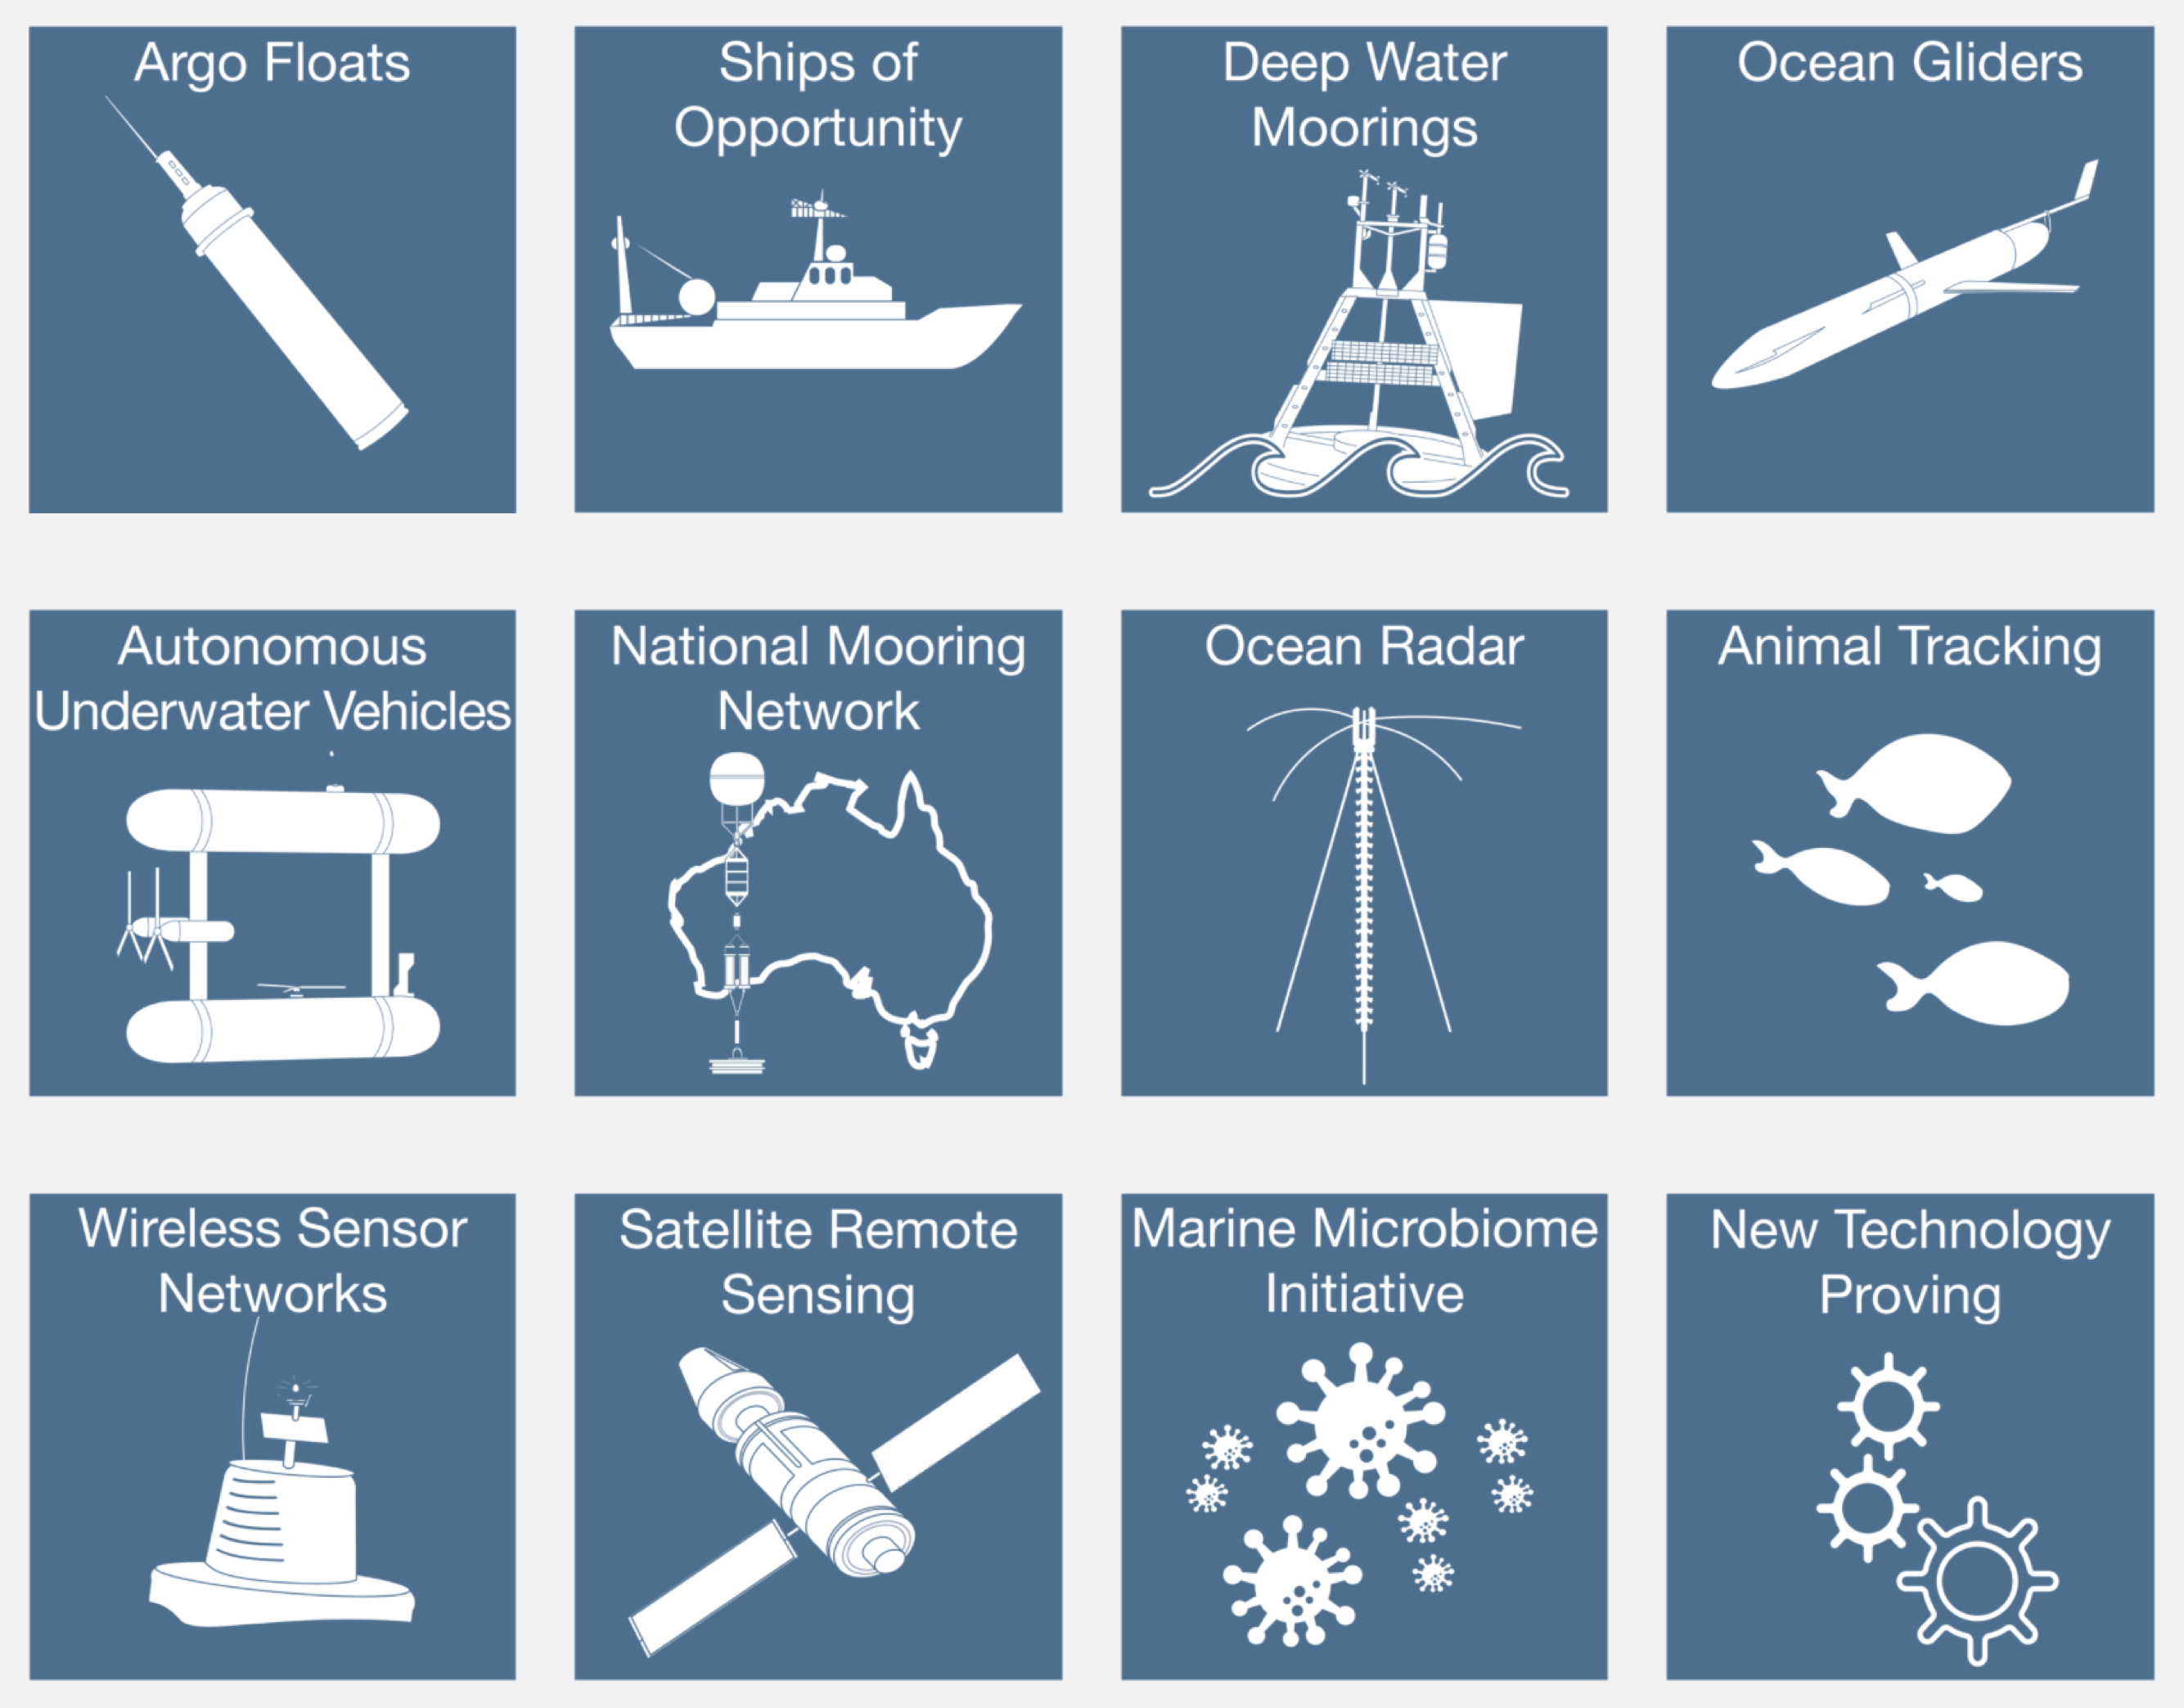
IMOS Facilities.
IMOS is a global leader in ocean observation. It has infrastructures that operate on continental scales, field observing technologies, shares best practices for a broad suite of variables, and generate masses of data. IMOS is partner with IOOS and OTN (this later is a global ocean research and technology development platform, in the area of animal tagging and tracking). To understand animal movements and survival, you also have to understand how the animals respond to changes in environmental conditions. Thus, the animal tracking effort is tightly integrated with the observation of the physical and chemical environment, and all networks depend on common platforms for oceanographic observations. Other observing technologies include Argo, moored buoys, high-frequency radar (HFR), and autonomous underwater vehicles known as gliders.
1.4. Access to ocean data
All the national systems that participate in the Global Ocean Observing System (GOOS) and the Group on Earth Observations (GEO) subscribe to the principal of free and open data. It is policy within Australia that all observational data collected with governmental funding support are made freely and openly available, which makes sense from scientific, disaster response, and economic perspectives.
Important
One challenge IMOS faces is the need to support operational systems, often with unique data formats, while simultaneously working to create mutually compatible data access systems and services, and common data formats and metadata standards, in order to facilitate access to this public resource through the internet.
IMOS provides marine data such as temperature, salinity, currents, wind speed/direction, waves, and other primarily physical observations for model assimilation through the GTS (Global Telecommunication System). For broader access, IMOS uses three standards to convey the information in an interoperable manner:
Open-source Project for a Network Data Access Protocol (OPeNDAP),
Sensor Observation Service (SOS) and Open Geospatial Consortium (OGC) Standard, and
Web Map Services (WMS) OGC Standard.
1.5. Modeling & Analysis
To access the Notebooks exercises use the following link:
![]()
Prediction of future conditions is critical to deliver the full benefits of an ocean observing system. The Australian ocean and coastal modeling community is a partnership between multiple universities and national organisations (CSIRO, IMOS, GA, BOM to cite a few) that is being asked to provide greater resolution models that cover not only traditional physical water circulation, which remains a critical need, but also expand outputs to include inundation forecasting and ecosystem modeling.
In May 2014, IMOS published the IMOS Strategy 2015-25. In this plan, one can read that:
Note
IMOS has a concerted focus on making data available and seeing that it is used. IMOS has worked with the coastal modeling community to make sure that available data are informing numerical models. Going forward, IMOS will use its infrastructure to be a coordinating entity to advance the assimilation and further development of coastal modeling. IMOS has begun a structured engagement with the coastal and ocean modeling communities through development of joint products (e.g., in ocean reanalysis), national workshops, and targeted infrastructure investment at the model-data interface (such as virtual laboratories).
1.5.1. Hands-on examples
As we just saw, access to quality data is essential to understand marine processes.
Over the last 20 years, ocean data portals have emerged and are routinely used to better understand the complexity of the ocean and its interactions with climate and life. These portals facilitate seamless access to marine data/services and promote the exchange and dissemination of ocean-related information.
Important
The information that is stored, processed, and exchanged, is at the heart of modern marine science. Ocean scientists routinely perform data crunching to understand a particular system and need to access and query extensive lists of dataset. Understanding how these data are stored, their origin and how to quickly retrieve particular information from them are crucial skills that you will need in your job!
Wave height measurements taken every day by a buoy offshore Sydney are data. A graph showing the evolution of the significant wave height over time, at a given place, is information. The fact that the number of extreme storms hitting Australian’s coast increases as a result of climate change is knowledge. These three notions are very closely linked.
1.5.2. Exercises for the lecture
Roughly speaking, here is how you should use them:
A piece of data provides a basic description, typically numerical for our purposes, of a given reality.
Drawing on the collected data, information is obtained by organising and structuring data so as to derive meaning.
By understanding the meaning of information, we obtain knowledge.
Note
One of the great challenges for Ocean Data users is to understand where and how to find technologies that make it possible to evaluate, validate, verify, and rank information to help them in their jobs. This involves understanding how the ocean data providers are organised, the main standards, vocabularies and formats which are used by the community as well as the best approach for accessing and querying these information routinely.
Important
Before starting the exercise, take some times to familiarise yourself with the environment. You will see in the IntroNotebook ipython notebook in your main repository a link to an introduction notebook that I highly recommend to do!
After following the video and the introduction notebook, you will open the workspace in binder and from the bottom of the IntroNotebook notebook you will click on the Ocean Data Query link. It will open a folder containing exercises and practicals:
OceanData1.ipynbandOceanData2.ipynbare 2 exercises that complement what you learned during this lecture,Oceanforecast.ipynbandWaverider.ipynbare Python notebooks that you will use for your practicals.
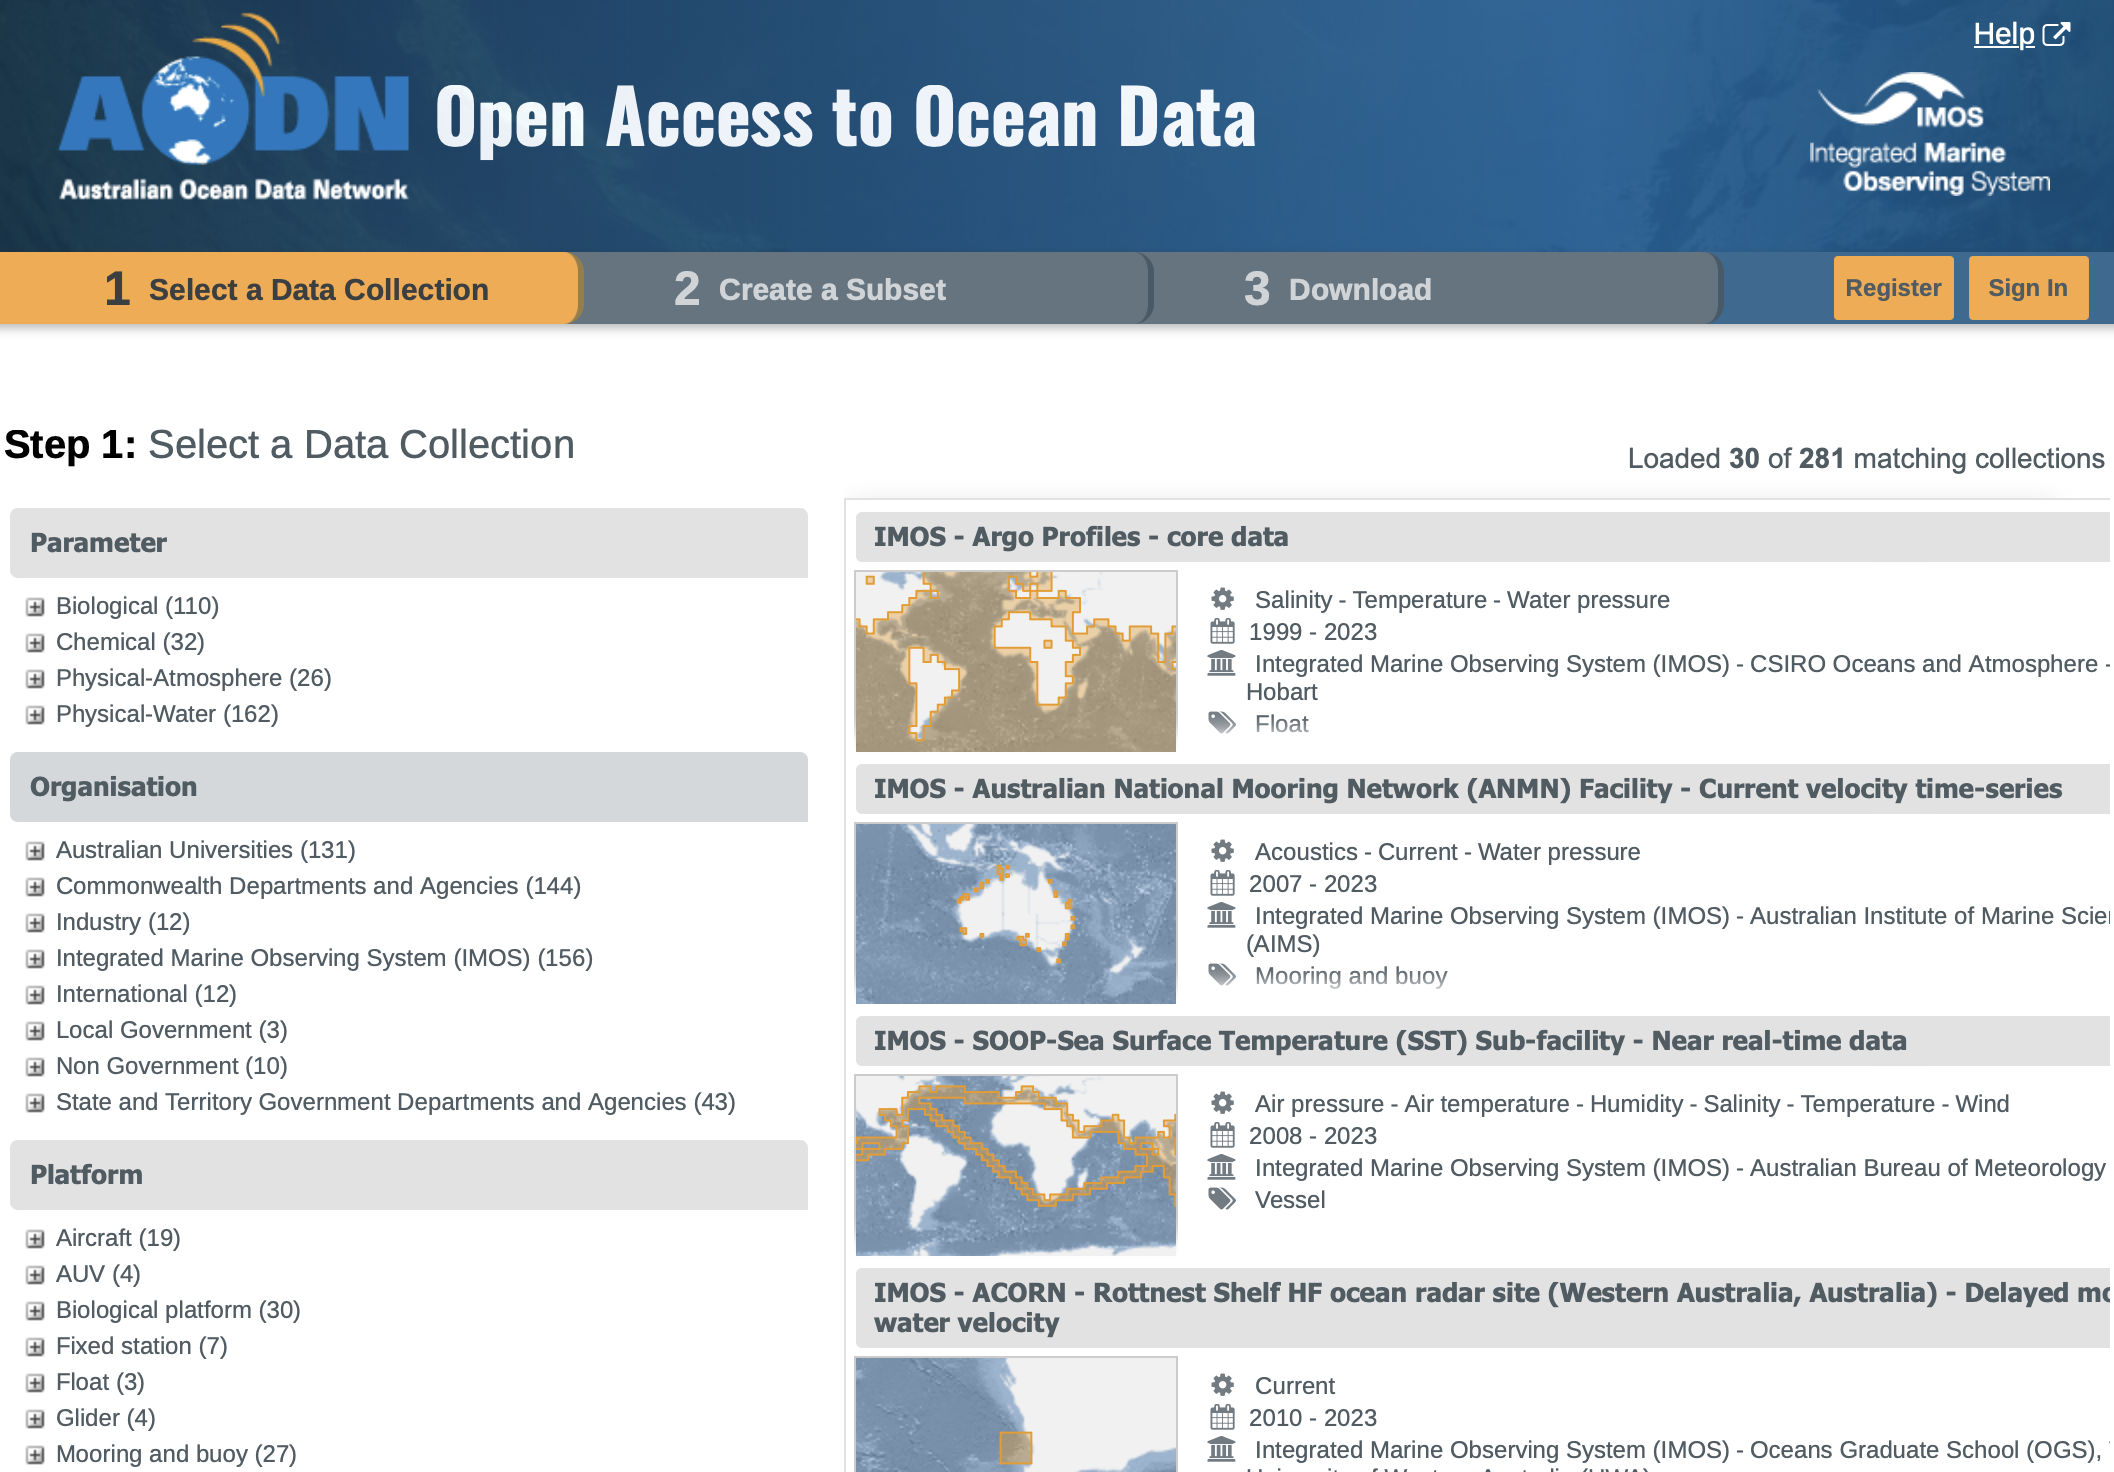
1.5.2.1. Loading and checking IMOS NetCDF dataset
Exercise 1.1
In this first example (OceanData1.ipynb), we will work with the IMOS Portal using Python via Jupyter Notebooks. There are several advantages of using Python as a general data analysis language and the notebook environment is a versatile tool that is designed to be interactive, user-friendly, open-source and sharable.
We will see how to load NetCDF data into a Python environment, and show how to use the data once loaded.
1.5.2.2. Querying and analysis Coastal Ocean Radar dataset
Exercise 1.2
In this second example (OceanData2.ipynb), the Australian Coastal Ocean Radar Network (ACORN) facility comprises a coordinated network of HF radars delivering real-time ocean surface velocity data. We will export the dataset file (NetCDF) for a given region and then we will plot the velocity field at a given time in a latitude/longitude grid.
1.5.3. Exercises for the Practical
Important
You will need to download the practical information sheet available from Canvas.
You will run a series of examples that will introduce some aspects of marine data querying.
Offshore Sydney wave buoy data from Australian Integrated Marine Observing System (IMOS) and
Different dataset from the Bureau of Meteorology, CSIRO as well as forecast model outputs from NOAA.
Extract Ocean Radar dataset for Turquoise Bay from IMOS and plot them on a map.
Download the practical documentation from Canvas website and answer the questions using: the Waverider.ipynb and Oceanforecast.ipynb notebook.
1.6. Summary
Working together, agencies like IMOS or IOOS help to manage our oceans by measuring them and connecting observations to people. Yet, ocean observing systems are only as good as our ability to observe and accurately model ocean systems.
Finding the resources to sustain coastal observations over relevant time scales is a big challenge.
Important
As coastal data users - we need to understand how ocean dataset are obtained, managed and stored. We also need to know how to efficiently load these dataset, query and analyse them.
As a growing population continues to stress our planet, quality observations will increase in importance. But it is not good enough to measure the planet, we also need to work to ensure this information comes into play in our communities, our economies, and in management decisions.